Multiple Choice
The diagram below shows desired aggregate expenditure for a hypothetical economy.Assume the following features of this economy:
∙ marginal propensity to consume (mpc) = 0.75
∙ net tax rate (t) = 0.20
∙ no foreign trade
∙ fixed price level
∙ all expenditure and income figures are in billions of dollars. 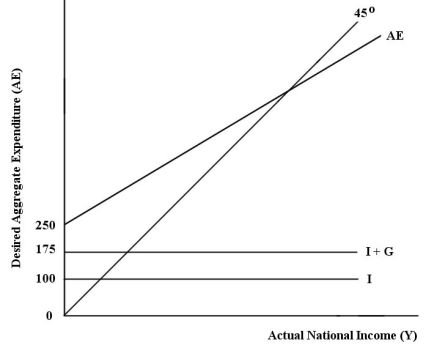 FIGURE 22-2
-Refer to Figure 22-2.What is the equilibrium national income in this economy?
A) $187.50
B) $294
C) $333.34
D) $625
E) $1666.67
Correct Answer:

Verified
Correct Answer:
Verified
Q9: In a simple macro model with a
Q10: A fall in domestic prices relative to
Q14: Consider the government's budget balance.Suppose G =
Q27: Consider the net export function.An increase in
Q37: Consider a simple macro model with government
Q49: Consider the following news headline: "Finance minister
Q71: Consider a model with demand-determined output and
Q87: Suppose exports are $940 and imports are
Q96: The table below shows national income and
Q110: Consider a macro model with a constant