Multiple Choice
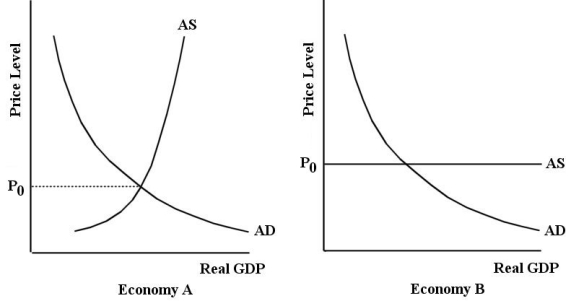 FIGURE 23-3
-Refer to Figure 23-3.Suppose the price level in Economy A is above  .Which of the following statements describes what would occur?
A) The AD curve would shift to the right until macro equilibrium is reached.
B) Real GDP would be below its equilibrium level which would put downward pressure on the price level until it reaches macro equilibrium at  .
.
C) The amount of output supplied by firms is greater than total desired expenditure; excess supply will put downward pressure on the price level until it reaches macro equilibrium at  .
.
D) Real GDP would be below its equilibrium level which would put upward pressure on the price level until it reaches macro equilibrium.
E) The AS curve would shift to the left until macro equilibrium is reached.
Correct Answer:

Verified
Correct Answer:
Verified
Q4: A decrease in aggregate supply in the
Q5: Consider the basic AD/AS model in the
Q9: <img src="https://d2lvgg3v3hfg70.cloudfront.net/TB5441/.jpg" alt=" FIGURE 23-5 -Refer
Q10: A rightward shift in the economy's AS
Q12: <img src="https://d2lvgg3v3hfg70.cloudfront.net/TB5441/.jpg" alt=" FIGURE 23-1 -Refer
Q13: Consider the AD/AS model.Suppose there is an
Q14: Consider a simple macro-model with demand-determined output.An
Q75: If the economy is in macroeconomic equilibrium
Q81: Which of the following will cause a
Q128: If the economy's AS curve is completely