Multiple Choice
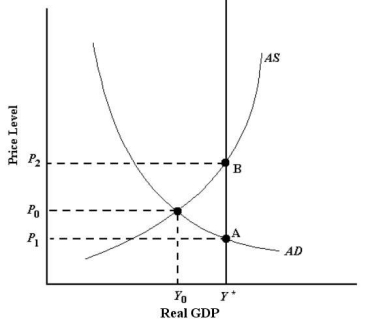 FIGURE 24-1
-Refer to Figure 24-1.If the economy is currently producing output of Y0,the economy's automatic adjustment process will have the
A) AS curve shifting to the right until point A is reached.
B) vertical line at Y* shifting to the left until it gets to Y0.
C) AD curve shifting to the right until point B is reached.
D) economy remaining where it is.
E) level of potential output falling.
Correct Answer:

Verified
Correct Answer:
Verified
Q26: The Phillips curve provides a theoretical link
Q44: Consider the basic AD/AS macro model in
Q50: Consider the AD/AS model,and suppose that the
Q118: In the basic AD/AS macro model,the "paradox
Q132: <img src="https://d2lvgg3v3hfg70.cloudfront.net/TB5441/.jpg" alt=" FIGURE 24-5 -Refer
Q136: In the long run in the AD/AS
Q139: An adjustment "asymmetry" in aggregate supply is<br>A)the
Q140: The table below shows data for five
Q142: Suppose the economy is initially in a
Q142: <img src="https://d2lvgg3v3hfg70.cloudfront.net/TB5441/.jpg" alt=" FIGURE 24-2 -Refer