Multiple Choice
The table below shows data for five economies of similar size.Real GDP is measured in billions of dollars.Assume that potential output for each economy is $340 billion.
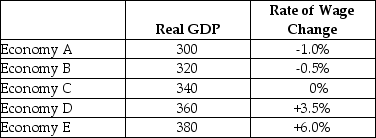 TABLE 24-1
-Refer to Table 24-1.How is the adjustment asymmetry demonstrated when comparing Economy A to Economy E?
A) The size of the output gap is the same in Economies A and E,but wages are rising in A and falling in E.
B) The output gap is larger in Economy A,yet wages are changing more slowly.
C) The output gap is much larger in Economy E,so wages are changing at a faster rate.
D) The size of the output gap is the same in Economies A and E but wages are falling more slowly in A than they are rising in E.
E) There is insufficient data with which to observe the adjustment asymmetry.
Correct Answer:

Verified
Correct Answer:
Verified
Q16: Following any AD or AS shock,economists typically
Q32: A reduction in the net tax rate
Q34: An inflationary output gap occurs when<br>A)actual GDP
Q47: Which of the following describes the distinction
Q102: In any decision about stimulating the economy
Q104: Suppose that the economy is initially in
Q107: The paradox of thrift does not exist
Q110: A common assumption among macroeconomists is that
Q140: Suppose the economy has a high level
Q145: Consider the basic AD/AS macro model in