Multiple Choice
The table below shows various values of labour (L) ,capital (K) ,and technology (T) for Economies A,B,and C.In each case,the aggregate production function takes the following form:
Y = T × 
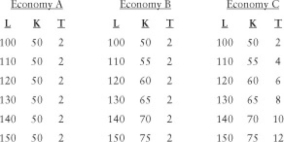 TABLE 25-4
-Refer to Table 25-4.Consider the changes shown for L,K,and T for Economy C,where output (Y) is the economy's real GDP.As total labour and capital inputs rise,this economy will show
A) rising GDP but falling per capita GDP.
B) rising GDP and rising per capita GDP.
C) rising GDP but constant GDP per capita.
D) GDP rising more slowly than labour.
E) GDP rising more slowly than capital.
Correct Answer:

Verified
Correct Answer:
Verified
Q10: According to the Neoclassical growth model,which of
Q19: The table below shows aggregate values for
Q23: The diagram below shows the market for
Q25: The diagram below show the market for
Q26: The costs of long-run economic growth include:<br>1)declining
Q27: The table below shows aggregate values for
Q28: Over a long period of time,perhaps many
Q66: Consider the market for financial capital in
Q71: For a given level of technology,a more
Q90: Consider the long-run theory of investment,saving and