Multiple Choice
The diagram below shows two budget deficit functions for a hypothetical economy. 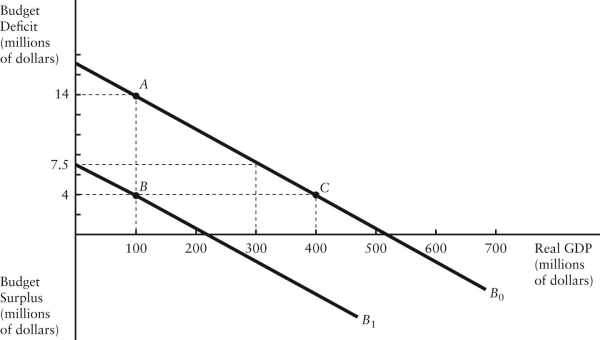 FIGURE 31-2
-Refer to Figure 31-2.Initially,suppose the economy is at point A on budget deficit function  .Real GDP (Y) is $100 million.If the level of potential output (Y*) were $300 million,how much of the actual budget deficit is due to the underlying structure of fiscal policy and is therefore independent of the current level of GDP?
A) $4 million.
B) $6.5 million.
C) $7.5 million.
D) $14 million.
E) Insufficient information to know.
Correct Answer:

Verified
Correct Answer:
Verified
Q9: Suppose the government's debt-to-GDP ratio on January
Q15: The data below provides the Actual and
Q17: Suppose the stock of government debt in
Q35: Consider a closed-economy AD/AS macro model.A policy-induced
Q36: The stock of government debt will continue
Q37: In general,the government will have _ flexibility
Q54: The government's structural budget deficit adjusts for<br>A)any
Q79: Consider the government's budget deficit function.Other things
Q107: Suppose the government decided to ensure that
Q113: Consider a government with a positive stock