Multiple Choice
The following diagrams show the production possibilities boundaries for Austria and Switzerland,for the production of bicycles and shoes. 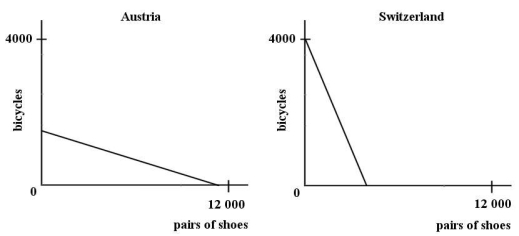 FIGURE 32-2
-Refer to Figure 32-2.The diagrams illustrate that the ________ is lower in Austria than in Switzerland.
A) opportunity cost of producing shoes
B) opportunity cost of producing bicycles
C) total cost of producing shoes
D) average cost of producing bicycles
E) comparative advantage in producing bicycles
Correct Answer:

Verified
Correct Answer:
Verified
Q31: Ireland and Japan are assumed to produce
Q32: When opportunity costs differ between countries,<br>A)comparative advantages
Q33: The diagram below shows the (hypothetical)demand and
Q34: Consider the following information about the production
Q35: This table shows how much cotton and
Q37: The following production possibilities schedule shows the
Q38: This table shows how much cotton and
Q39: There will be no gains from specialization
Q40: This table shows how much cotton and
Q41: According to what economists call the "law