Multiple Choice
The diagram below shows the demand and supply curves for refrigerators in Canada. 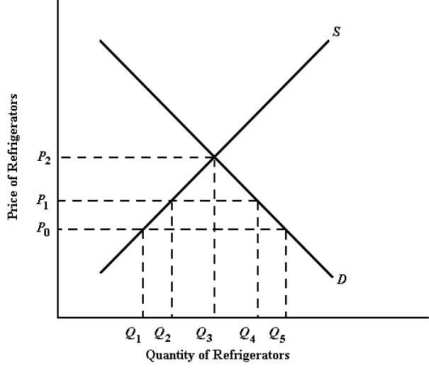 FIGURE 33-1
-Refer to Figure 33-1.At the price P0,the quantity of refrigerators supplied to the Canadian market by domestic Canadian producers is
A) Q1.
B) Q2.
C) Q3.
D) Q4.
E) Q5.
Correct Answer:

Verified
Correct Answer:
Verified
Related Questions
Q39: In international trade,"dumping" is defined as charging<br>A)a
Q68: Many people argue that the imposition of
Q69: The diagram below shows the domestic demand
Q71: The table below shows the prices in
Q75: The diagram below shows the domestic demand
Q76: The effect of a tariff on a
Q77: Suppose Canada imposes a 20% tariff on
Q91: Suppose Canada has a 20% tariff on
Q105: When a country chooses to protect domestic
Q116: The General Agreement on Tariffs and Trade