Multiple Choice
The diagram below shows the demand and supply curves for refrigerators in Canada. 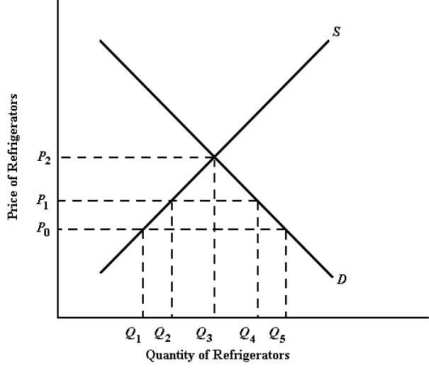 FIGURE 33-1
-Refer to Figure 33-1,and assume the world price is P0.The Canadian government now imposes an import quota of the amount Q2Q4.The result would be that the price in Canada would
A) stay at P0 and consumption would stay at Q5.
B) stay at P0 and consumption would rise to Q3.
C) rise to P2 and consumption would decrease to Q5.
D) rise to P2 and consumption would decrease to Q4.
E) rise to P1 and consumption would decrease to Q4.
Correct Answer:

Verified
Correct Answer:
Verified
Q3: An agreement among a group of countries
Q11: It is not possible for one country
Q14: The diagram below shows supply and demand
Q15: An example of the "infant industry" argument
Q17: Economists would tend to accept which of
Q19: The diagram below shows the domestic demand
Q20: The diagram below shows the domestic demand
Q20: Any policy designed to benefit domestic industries
Q54: A business which contends that it needs
Q120: Which of the following actions (all of