Multiple Choice
The table below shows indexes for the price levels for Canada and the United States and the nominal exchange rate between their currencies (the Canadian-dollar price of 1 U.S.dollar) .
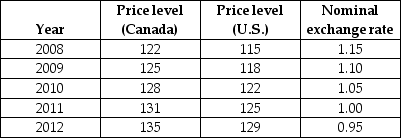 TABLE 34-2
-Refer to Table 34-2.According to the theory of purchasing power parity (PPP) ,the Canada-US exchange rate in 2008 should have been
A) 115/122 = 0.94.
B) 1.15,the actual exchange rate that year.
C) (122 × 115) /100 = 140.3.
D) 122,the price level in Canada that year.
E) 122/115 = 1.06.
Correct Answer:

Verified
Correct Answer:
Verified
Q4: A credit entry in Canada's balance-of-payments accounts<br>A)is
Q8: <img src="https://d2lvgg3v3hfg70.cloudfront.net/TB5441/.jpg" alt=" FIGURE 34-2 -Refer
Q9: <img src="https://d2lvgg3v3hfg70.cloudfront.net/TB5441/.jpg" alt=" FIGURE 34-2 -Refer
Q10: A debit entry in the Canadian balance-of-payments
Q14: Suppose the Bank of Canada raises its
Q47: Suppose we hear on the news that
Q57: Consider a country that is operating under
Q61: Consider the market in which Canadian dollars
Q92: A rise in the Canadian-dollar price of
Q136: We can expect that an increase in