Multiple Choice
The following graph is a ________. 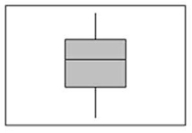
A) dot plot
B) stem-and-leaf display
C) box plot
D) contingency table
Correct Answer:

Verified
Correct Answer:
Verified
Related Questions
Q54: The 75th percentile is referred to as
Q55: The 67th percentile is _.<br>A)the value above
Q56: In a scatter diagram,we describe the relationship
Q57: Percentiles divide a distribution into 100 equal
Q58: A scatter diagram of sales versus production
Q59: In a contingency table,we describe the relationship
Q60: A box plot shows _.<br>A)the mean and
Q62: The coefficient of skewness is the standard
Q63: The test scores for a class of
Q64: A large oil company is studying the