Multiple Choice
The following graph is a ________. 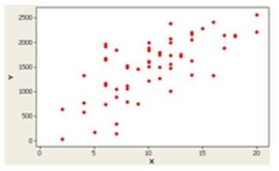
A) dot plot
B) stem-and-leaf display
C) box plot
D) scatter diagram
Correct Answer:

Verified
Correct Answer:
Verified
Related Questions
Q5: A scatter diagram is used to illustrate
Q6: A dot plot is useful for quickly
Q7: The range of the coefficient of skewness
Q8: A dot plot is best applied when
Q9: To locate the percentile for a given
Q11: If a student places in the 99th
Q12: A box plot graphically shows the 10th
Q13: If the coefficient of skewness is equal
Q14: Quartiles divide a distribution into _.<br>A)2 equal
Q15: Using the following statistics to describe a