Multiple Choice
Refer to the following breakdown of responses to a survey of "How confident are you that you saved enough to retire?" 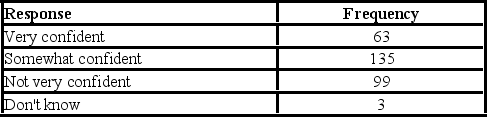 What percentage of the responses indicated that users were very confident?
A) 63%
B) 21%
C) 45%
D) 33%
Correct Answer:

Verified
Correct Answer:
Verified
Related Questions
Q4: Refer to the following frequency distribution of
Q5: In order to convert class frequency to
Q6: Refer to the following frequency distribution of
Q7: In frequency distributions,classes are mutually exclusive if
Q8: Refer to the following breakdown of responses
Q10: Refer to the following frequency distribution of
Q11: Refer to the following distribution of ages:
Q12: Refer to the following breakdown of responses
Q13: A pie chart is similar to a
Q14: To convert a frequency distribution to a