Multiple Choice
This graph describes the production possibilities on the island of Genovia: 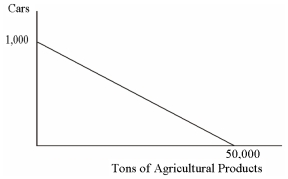 The opportunity cost of producing one car in Genovia is:
A) 5,000 tons of agricultural products.
B) 500 tons of agricultural products.
C) 5 tons of agricultural products.
D) 50 tons of agricultural products.
Correct Answer:

Verified
Correct Answer:
Verified
Q64: Having a comparative advantage in a particular
Q65: This graph describes the production possibilities on
Q66: The fundamental reason the production possibilities curve
Q67: Ginger and Maryann are lost in the
Q68: If a nation has the lowest opportunity
Q70: Point A on a linear production possibilities
Q71: According to the principle of increasing opportunity
Q72: Dent 'n' Scratch Used Cars and
Q73: The slope of any production possibilities curve
Q74: NAFTA helped _ to exploit a comparative