Multiple Choice
In the graph at shown,X and Y represent 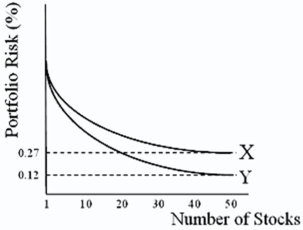
A) U.S.stocks and international stocks.
B) international stocks and U.S.stocks.
C) systematic risk and unsystematic risk.
D) none of the options
Correct Answer:

Verified
Correct Answer:
Verified
Q75: American Depository Receipt (ADRs)represent foreign stocks<br>A)denominated in
Q76: Calculate the euro-based return an Italian investor
Q77: Calculate the euro-based return an Italian investor
Q78: Assume that you have invested $100,000 in
Q79: You invested $100,000 in British equities.The stock's
Q81: With regard to the OIP,<br>A)the composition of
Q82: In May 1995 when the exchange rate
Q83: For those investors who desire international equity
Q84: Foreign equities as a proportion of U.S.investors'
Q85: WEBS are<br>A)World Equity Benchmark Shares.<br>B)exchange-traded open-end country