Multiple Choice
Which of the lines is a graph of the profit at maturity of writing a call option on €62,500 with a strike price of $1.20 = €1.00 and an option premium of $3,125? 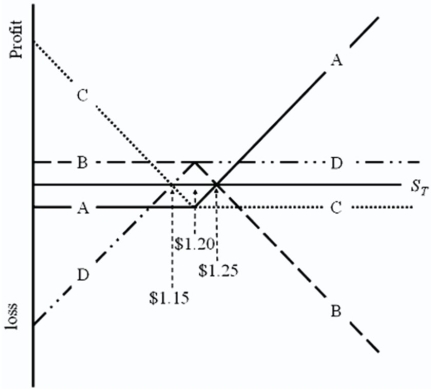
A) A
B) B
C) C
D) D
Correct Answer:

Verified
Correct Answer:
Verified
Related Questions
Q2: The current spot exchange rate is $1.55
Q3: Which of the follow options strategies are
Q4: In reference to the futures market,a "speculator"<br>A)attempts
Q5: In the event of a default on
Q6: A CME contract on €125,000 with September
Q8: The current spot exchange rate is
Q9: The current spot exchange rate is
Q10: The "open interest" shown in currency futures
Q11: Consider an option to buy €12,500
Q12: Assume that the dollar-euro spot rate