Multiple Choice
Which of the following statements best explains the trends shown in Figure 1.8? 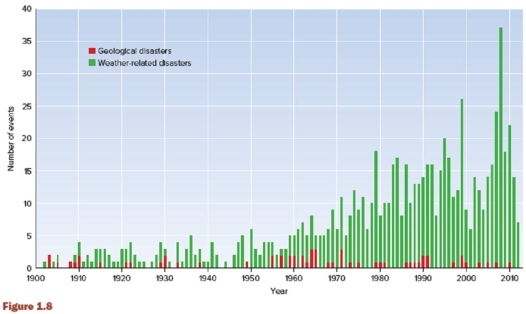
A) The increase in weather related disasters is due solely to global warming.
B) The frequency and magnitude of geologic disasters has been increasing.
C) The trends in this graph are unlike the global trends in natural disasters.
D) Population growth and the impact of television and Internet reporting are likely responsible for some of the increase in weather related disasters.
E) The increase in weather-related disasters shows that Canadian Society has adapted more than adequately to extreme weather events.
Correct Answer:

Verified
Correct Answer:
Verified
Q6: By the year 2011 B.C.E. ,the world's
Q7: The overall increase in Canadian natural disasters
Q8: The magnitude of a hazardous event is
Q8: In general,the larger and more energetic the
Q9: As of 2011 the human population of
Q11: The world population of humans is growing
Q12: According to Princeton researchers more than 80%
Q13: The rapid increase in human population during
Q15: The amount of water recommended for a
Q43: At present,the world population is growing at