Multiple Choice
Suppose the figure below illustrates the demand curve facing a monopolist. 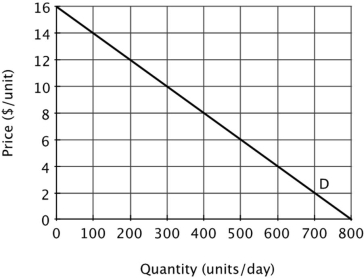 At a price of $8 per unit, the total revenue for this monopolist is ______ per day, and the marginal revenue earned from the last unit sold is ______.
A) $8; $8
B) $3,200; $8
C) $3,200; $4
D) $3,200; $0
Correct Answer:

Verified
Correct Answer:
Verified
Q31: Suppose Campus Books, a profit-maximizing firm,
Q32: Suppose Island Bikes, a profit-maximizing firm,
Q34: If a firm collects $90 in revenue
Q37: Suppose the table below describes the
Q41: Suppose the table below describes the
Q71: If the demand curve facing the monopolist
Q75: In exchange for a share of the
Q92: Industries in which firms have high fixed
Q110: Which of the following industries does not
Q126: Suppose a monopolist produces two different products.