Multiple Choice
The figure below shows the demand curve, marginal revenue curve, marginal cost curve and average total cost curve for a monopolist. 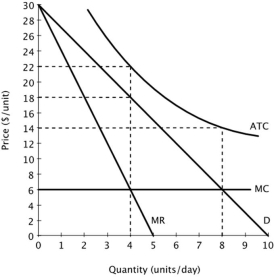 At the socially optimal level of output, this monopolist would:
A) earn an economic profit of $16.
B) incur an economic loss of $16.
C) incur an economic loss of $64.
D) incur an economic loss of $112.
Correct Answer:

Verified
Correct Answer:
Verified
Q25: Suppose Campus Books, a profit-maximizing firm,
Q26: Suppose a monopolist faces the demand curve
Q27: Suppose Island Bikes, a profit-maximizing firm,
Q30: Suppose the table below describes the
Q31: Suppose Campus Books, a profit-maximizing firm,
Q32: Suppose Island Bikes, a profit-maximizing firm,
Q92: Industries in which firms have high fixed
Q97: Both a perfectly competitive firm and a
Q126: Suppose a monopolist produces two different products.
Q132: The reason economists consider monopoly to be