Multiple Choice
The figure below depicts the short-run market equilibrium in a perfectly competitive market and the cost curves for a representative firm in that market. Assume that all firms in this market have identical cost curves. 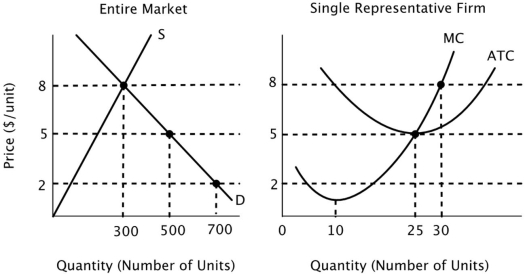 Given that the current equilibrium price is $8, what will happen to the number of firms in this market in the long run?
A) The number of firms in the market will not change unless there is a change in either demand or in the cost of production.
B) The number of firms in the market will fall as firms exit the market in response to negative economic profit.
C) It is impossible to determine whether the number of firms in this market will rise or fall.
D) The number of firms in the market will rise as firms enter the market in response to positive economic profit.
Correct Answer:

Verified
Correct Answer:
Verified
Q8: Suppose you own a small business. Last
Q9: Refer to the table below. An
Q12: Refer to the figure below. <img src="https://d2lvgg3v3hfg70.cloudfront.net/TB3719/.jpg"
Q17: In perfectly competitive markets, an implication of
Q23: The role that prices play in distributing
Q83: The role that prices play in directing
Q109: Which of the following statements about explicit
Q121: If all firms in a perfectly competitive
Q126: Which of the following is NOT necessarily
Q140: The allocative function of price is to:<br>A)distribute