Multiple Choice
The figure below depicts the short-run market equilibrium in a perfectly competitive market and the cost curves for a representative firm in that market. Assume that all firms in this market have identical cost curves. 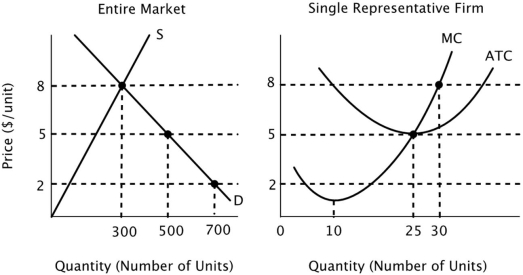 In the long run equilibrium in this market:
A) price will equal $5, and there will be 20 firms in the industry.
B) price will equal $5, and there will be 10 firms in the industry.
C) price will equal $8, and there will be 20 firms in the industry.
D) price will equal $5 and total output will equal 500 units, but there is not enough information to determine how many firms will be in the industry.
Correct Answer:

Verified
Correct Answer:
Verified
Q14: The sum of producer surplus and consumer
Q38: Superstar professional athletes can sustain their economic
Q50: The supplier of a factor of production
Q58: In a perfectly competitive market, if supply
Q89: Suppose the market for coffee is in
Q118: Generally, _ motivates firms to enter an
Q144: Suppose a small island nation imports sugar
Q147: Mary Jane is willing to babysit for
Q147: Assume that all firms in this industry
Q148: Entry into a perfectly competitive industry to