Multiple Choice
The figure below shows the supply and demand curves for jeans in Smallville. 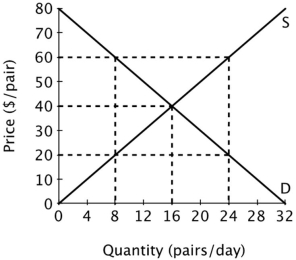 At a price of $60 per pair, there will be an excess ______ of ______ pairs of jeans per day.
A) supply; 24
B) supply; 16
C) demand; 16
D) demand; 8
Correct Answer:

Verified
Correct Answer:
Verified
Q3: E-commerce and an internet presence are important
Q35: Pat used to work as an aerobics
Q60: Suppose the production of cotton causes substantial
Q67: Refer to the figure below. <img src="https://d2lvgg3v3hfg70.cloudfront.net/TB3719/.jpg"
Q70: Assume that all firms in this industry
Q71: Refer to the table below. An
Q73: Assume that all firms in this industry
Q74: Assume that all firms in this industry
Q115: Economic rent is:<br>A)the amount people pay for
Q157: Suppose the production of cotton causes substantial