Multiple Choice
The figure below shows the supply and demand curves for jeans in Smallville. 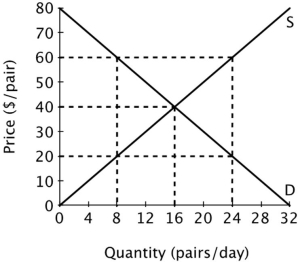 Suppose jeans initially sell for $60 per pair. If the price of jeans falls to $40 per pair, then total economic surplus will increase by ______ per day.
A) $160
B) $80
C) $40
D) $20
Correct Answer:

Verified
Correct Answer:
Verified
Q13: A market equilibrium is only efficient if:<br>A)the
Q27: Assume that all firms in this industry
Q31: The figure below depicts the short-run market
Q33: Assume that all firms in this industry
Q63: Factors of production are the most likely
Q80: If an individual producer is willing to
Q101: Consumer surplus is the cumulative difference between:<br>A)consumers'
Q103: Which of the following is a characteristic
Q110: The phrase "smart for one, but dumb
Q150: Ingrid has been waiting for the show