Multiple Choice
The following graph depicts demand. 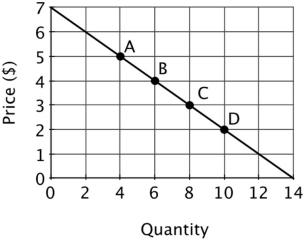 The slope of the demand curve (ignoring the negative sign) is:
A) 2.
B) 1.5.
C) 1.
D) 0.5.
Correct Answer:

Verified
Correct Answer:
Verified
Related Questions
Q2: If the percentage change in the price
Q21: If two products are substitutes, then the:<br>A)income
Q30: If the absolute value of slope of
Q57: If the income elasticity for a particular
Q83: Satellite TV is a close substitute for
Q95: Refer to the figure below. The absolute
Q96: Refer to the figure below. When the
Q104: If the price elasticity of demand for
Q133: The inputs used to produce cupcakes (e.g.,
Q137: If demand is _ with respect to