Multiple Choice
The following graph depicts demand. 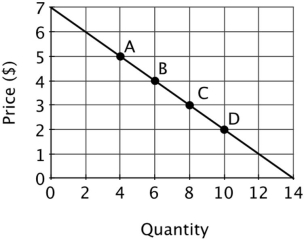 The price elasticity of demand at point A is:
A) 5/2.
B) 5/8.
C) 2/5.
D) 8/5.
Correct Answer:

Verified
Correct Answer:
Verified
Related Questions
Q25: If the price elasticity of demand for
Q38: If the price elasticity of demand for
Q39: Suppose that a new drug has been
Q41: Which of the following is likely to
Q43: Refer to the figure below. At a
Q44: Suppose that a new drug has been
Q47: Refer to the figure below. If the
Q79: A perfectly elastic demand curve has a
Q116: At a price of $20 each, the
Q118: Suppose that the demand for electricity has