Multiple Choice
The following graph depicts demand. 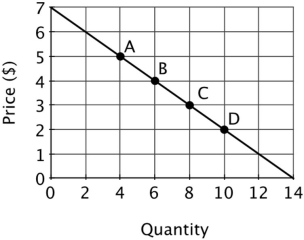 The price elasticity of demand at point B is:
A) 3/4.
B) 4/3.
C) 3.
D) 1/3.
Correct Answer:

Verified
Correct Answer:
Verified
Related Questions
Q18: Suppose that each serving of Mac &
Q25: If the price elasticity of demand for
Q29: Suppose that if the price of plane
Q44: Suppose that a new drug has been
Q47: Refer to the figure below. If the
Q50: If the demand for electricity is inelastic,
Q51: If the absolute value of the price
Q53: Suppose that a new drug has been
Q90: Suppose that Chris had been charging $1.00
Q118: Suppose that the demand for electricity has