Multiple Choice
The following graph depicts demand. 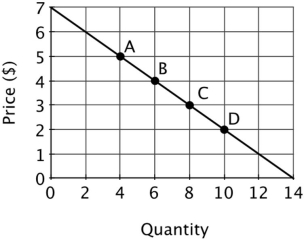 The price elasticity of demand at point C is:
A) 3/16.
B) 16/3.
C) 3/4.
D) 3/8.
Correct Answer:

Verified
Correct Answer:
Verified
Related Questions
Q7: During recessions, when some workers lose their
Q39: For any horizontal demand curve, the price
Q41: The demand for a good is inelastic
Q61: If the price elasticity of demand for
Q63: Pepsi One is a close substitute for
Q67: The price elasticity of demand for a
Q68: If 20% increase in the price of
Q71: If a 10% decrease in the price
Q78: If the slope of a demand curve
Q127: Suppose you have one hour to catch