Multiple Choice
The following graph depicts demand. 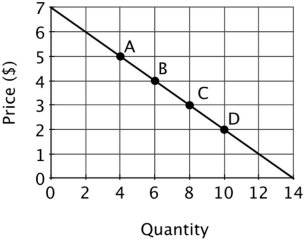 The price elasticity of demand at point D is:
A) 5/2.
B) 1/2.
C) 2/5.
D) 2.
Correct Answer:

Verified
Correct Answer:
Verified
Related Questions
Q11: Suppose a 10% increase in the price
Q19: Refer to the figure below. What is
Q24: The responsiveness of the quantity demanded of
Q46: The percentage change in quantity demanded that
Q48: If the cross-price elasticity of demand between
Q53: The demand for a good is elastic
Q98: Suppose that total expenditures for coffee reach
Q113: Suppose that the short-run price elasticity of
Q119: You would expect the price elasticity of
Q151: If a one percent increase in the