Multiple Choice
The figure below shows the production possibilities curve for the island of Genovia: 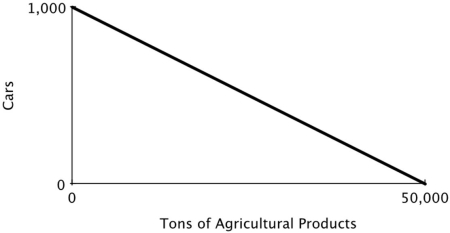 The opportunity cost of producing one ton of agricultural products in Genovia is:
A) 1,000 cars.
B) 1 car.
C) 1/5 of a car.
D) 1/50 of a car.
Correct Answer:

Verified
Correct Answer:
Verified
Related Questions
Q8: The downward slope of the production possibilities
Q50: The benefits of specialization can be used
Q124: The figure below shows Avery's weekly production
Q125: Refer to the figure below. The opportunity
Q126: Refer to the figure below. For Chris,
Q127: Moe divides his time between studying Physics
Q128: Dent 'n' Scratch Used Cars and
Q131: Refer to the figure below. For Chris,
Q132: Earth Movers & Shakers operates 3
Q133: Economic growth can result from a(n):<br>A)increase in