Multiple Choice
The figure below shows Avery's weekly production possibilities curve for scarves. 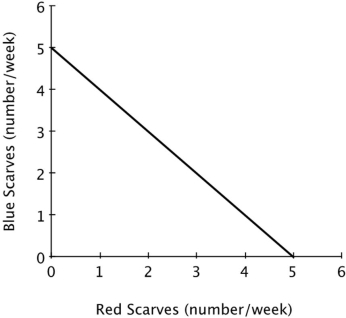 For Avery, the opportunity cost of making a red scarf is:
A) decreasing.
B) increasing.
C) 1 blue scarf.
D) zero.
Correct Answer:

Verified
Correct Answer:
Verified
Related Questions
Q44: Smith and Jones comprise a two-person
Q45: You are the Minister of Trade for
Q47: Dent 'n' Scratch Used Cars and
Q48: Ginger and Maryann are lost in the
Q52: The figure below shows Becky's daily production
Q54: Refer to the table below. Based
Q96: On a graph of a production possibilities
Q103: All else equal, the jobs that are
Q122: Suppose Colin brews beer and makes cheese.
Q146: An increase in an economy's productive resources