Multiple Choice
This graph shows the marginal cost and marginal benefit associated with roadside litter clean up. Assume that the marginal benefit curve and marginal cost curve each have their usual slope. 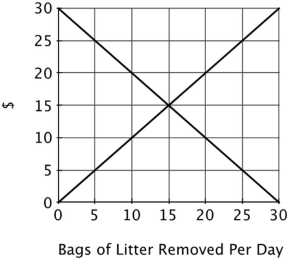 According to this graph, the marginal benefit of litter removal is highest when the ______ bag of litter is removed.
A) first
B) 10th
C) 15th
D) 30th
Correct Answer:

Verified
Correct Answer:
Verified
Q4: This graph shows the marginal cost and
Q6: Suppose that a vaccine is developed for
Q8: Consider two restaurants located next door
Q9: The following data show the relationship
Q23: Suppose there are ten people playing cards
Q74: Lunch in Jamie's dorm is an all-you-can-eat
Q102: Curly and Moe are considering living alone
Q124: Suppose that the EPA has proposed strict
Q148: When Brady is driving he throws his
Q150: If the marginal cost of reducing pollution