Multiple Choice
The figure shows a standard normal N(0, 1) distribution. Find the shaded area. 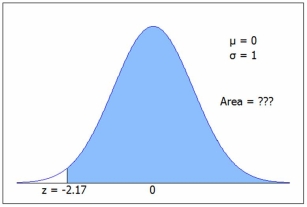 C.2 gives 1 - P(z < -2.17) = 1 - .0150 = 0.9750 =1-NORM.S.DIST(-2.17,1) .
A) .6444
B) .7514
C) .9245
D) 0.9850
Correct Answer:

Verified
Correct Answer:
Verified
Related Questions
Q109: The exponential distribution can be either right-skewed
Q110: If adult male heights are normally distributed
Q111: Experience suggests that 4 percent of all
Q112: The ages of job applicants for a
Q113: A software developer makes 175 phone calls
Q115: The normal distribution is a good approximation
Q116: Bob's z-score for the last exam was
Q117: Bob's z-score for the last exam was
Q118: Excel's =RAND() function produces random numbers that
Q119: Could this function be a PDF? <img