Multiple Choice
The figure shows a standard normal N(0, 1) distribution. Find the shaded area. 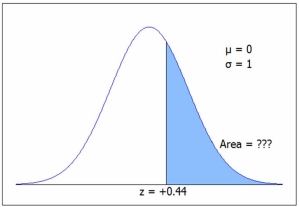 C.2. gives 1 - P(z < .44) = 1 - .6700 = .3300 =1-NORM.S.DIST(0.44,1) .
A) .4400
B) .3300
C) .2998
D) .2502
Correct Answer:

Verified
Correct Answer:
Verified
Related Questions
Q48: The triangular distribution is symmetric.
Q49: If arrivals follow a Poisson distribution, waiting
Q50: Exam scores were normal in BIO 200.
Q51: What are the mean and standard deviation
Q52: In Melanie's Styling Salon, the time to
Q54: The exponential distribution is always skewed right.
Q55: The lengths of brook trout caught in
Q56: If arrivals occur at a mean rate
Q57: In a continuous distribution:<br>A)P(X < 5) is
Q58: The time required for a citizen to