Multiple Choice
The figure shows a standard normal N(0, 1) distribution. Find the z value for the shaded area. 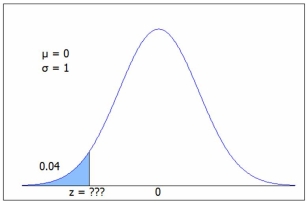 C.2 gives P(z < -1.75) = .0401 or use Excel =NORM.S.INV(0.04) = -1.75.
A) -1.98
B) -1.87
C) -1.75
D) -1.62
Correct Answer:

Verified
Correct Answer:
Verified
Related Questions
Q4: A continuous uniform distribution is always symmetric.
Q5: For a continuous uniform distribution U(200, 400),
Q6: Which statement is incorrect?<br>A)The triangular distribution always
Q7: We would use a normal distribution to
Q8: Historically, the default rate on a certain
Q10: Any normal distribution has a mean of
Q11: Compared to the area between z =
Q12: The time required for a citizen to
Q13: The probability that a rental car will
Q14: TotCo is developing a new deluxe baby