Multiple Choice
The figure shows a normal N(400, 23) distribution. Find the approximate shaded area. 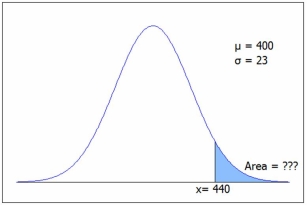 C.2 gives 1 - P(z < 1.74) = 1 - .9591 = .0409, or from Excel =1-NORM.DIST(440,400,23,1) = .0410.
A) .0410
B) .0501
C) .0724
D) .0838
Correct Answer:

Verified
Correct Answer:
Verified
Related Questions
Q68: A continuous uniform distribution U(100, 200) will
Q69: In a T-F exam with 100 questions,
Q70: The normal is a good approximation to
Q71: A large number of applicants for admission
Q72: A student's grade on an examination was
Q74: A multiple choice exam has 100 questions.
Q75: The normal distribution is a good approximation
Q76: The area under an exponential curve can
Q77: The height and width of a continuous
Q78: The area under a normal curve is