Multiple Choice
The mean of a population is 50 and the median is 40. Which histogram is most likely for samples from this population? 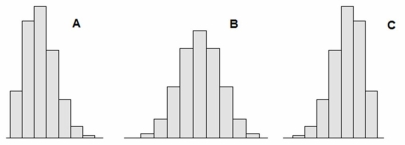
A) Sample A
B) Sample B.
C) Sample C.
Correct Answer:

Verified
Correct Answer:
Verified
Related Questions
Q62: Which is a characteristic of the standard
Q63: The Empirical Rule can be applied to
Q64: The Empirical Rule assumes that the distribution
Q65: Based on daily measurements, Bob's weight
Q66: It is inappropriate to apply the Empirical
Q68: Find the sample correlation coefficient for
Q69: Estimate the mean exam score for
Q70: Find the standard deviation of this sample:
Q71: A data set with two values that
Q72: Outliers are indicated using fences on a<br>A)box