Essay
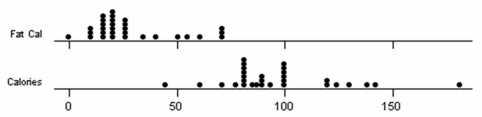
A team of introductory statistics students went to a grocery store and recorded the total calories and fat calories for various kinds of soup. They produced a table of statistics and two dot plots. Write a succinct summary of the center, variability, and shape for each data set. Note: TrimMean is the 5 percent trimmed mean (removing the smallest 5 percent and the largest 5 percent of the values, rounded to the nearest integer).
Correct Answer:

Verified
Both are right-skewed (mean > median) th...View Answer
Unlock this answer now
Get Access to more Verified Answers free of charge
Correct Answer:
Verified
View Answer
Unlock this answer now
Get Access to more Verified Answers free of charge
Q76: Which statistics offer robust (resistant to outliers)
Q77: The range as a measure of variability
Q78: A certain health maintenance organization (HMO) examined
Q79: The athletic departments at 10 randomly selected
Q80: A sample consists of the following data:
Q82: Three randomly chosen Colorado students were asked
Q83: The owner of a chicken farm
Q84: Three randomly chosen Seattle students were asked
Q85: Which statement is false?<br>A)The coefficient of variation
Q86: Referring to this box plot of ice