Multiple Choice
Using the supply and demand curves shown in the graph that follows,what is the equilibrium price for soft drinks? 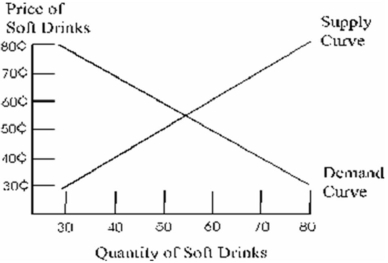
A) 35 cents
B) 45 cents
C) 50 cents
D) 55 cents
E) 75 cents
Correct Answer:

Verified
Correct Answer:
Verified
Related Questions
Q62: In a capitalist system,individuals own and operate
Q63: All of the following are associated with
Q64: Define competition,and describe the different forms it
Q65: Gross domestic product is the sum of
Q66: _ is the study of how resources
Q68: The primary goal of business activities is
Q69: Free-market capitalism and laissez-faire capitalism are essentially
Q70: A continuing rise in prices over a
Q71: The _ is the price at which
Q72: What would you do in Shelly's position?