Multiple Choice
The figure shows the graph of vx versus time for an object moving along the x-axis.Solve graphically for the distance traveled between t = 5.0 s and t = 9.0 s. 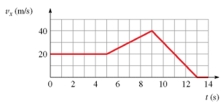
A) 110 m
B) 120 m
C) 100 m
D) 130 m
Correct Answer:

Verified
Correct Answer:
Verified
Related Questions
Q13: A ball is thrown downward from the
Q19: A projectile is projected from the origin
Q57: A mouse is running away from a
Q58: A projectile is projected from the origin
Q59: Two masses are being pulled up a
Q60: A rocket is launched from the origin
Q63: A mouse is running away from a
Q64: Two masses are connected by a string
Q65: If a flea can jump up to
Q66: On the way to lower floors,an elevator