Multiple Choice
The figure shows the graph of vx versus time for an object moving along the x-axis.Solve graphically for the average acceleration between t = 5.0 s and t = 9.0 s. 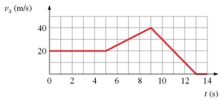
A) 4.0 m/s2
B) 5.0 m/s2
C) 0.5 m/s2
D) 0.4 m/s2
Correct Answer:

Verified
Correct Answer:
Verified
Related Questions
Q6: A ball is thrown straight up with
Q21: Two masses are being pulled up a
Q31: A projectile is projected from the origin
Q43: A rock is thrown straight up and
Q44: A blue ball is dropped from the
Q45: A projectile is projected from the origin
Q50: Two masses are being pulled up a
Q52: A sprinter runs 100.0 m in 9.87
Q68: Human reaction time is usually greater than
Q124: A 35.0 kg girl swings on a