Multiple Choice
Figure 18-1 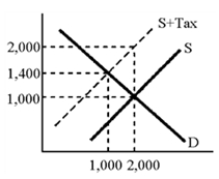
-According to the graph in Figure 18-1, the tax is which of the following?
A) 400
B) 600
C) 1,000
D) 200
Correct Answer:

Verified
Correct Answer:
Verified
Related Questions
Q147: The head tax is regressive.
Q148: Under a regressive tax, the fraction of
Q149: Edgar Browning and William Johnson, in a
Q150: Tax loopholes are equally available to all
Q151: Figure 18-1 <img src="https://d2lvgg3v3hfg70.cloudfront.net/TB8592/.jpg" alt="Figure 18-1
Q153: The payroll tax appears to be a
Q154: Over the past decade, increasing real wages
Q155: Which of the following is a direct
Q156: The idea of horizontal equity in taxation
Q157: Homeowners<br>A)are subject to double taxation.<br>B)benefit from several