Multiple Choice
Figure 18-1
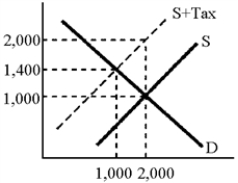
-According to the graph in Figure 18-1, the increase in the amount that consumers pay as a result of the tax is
A) 1000
B) 600
C) 400
D) indeterminate
Correct Answer:

Verified
Correct Answer:
Verified
Related Questions
Q6: The second largest source of revenue for
Q89: "People who make more money should pay
Q105: The payroll tax is the federal government's
Q125: The money for Social Security payments to
Q153: The payroll tax appears to be a
Q166: The concept that describes the situation where
Q191: The marginal tax rate has less effect
Q192: Which of the following is an example
Q201: Homeowners receive tax benefits that are not
Q204: The share of GDP taken by taxes