Multiple Choice
Figure 22-6
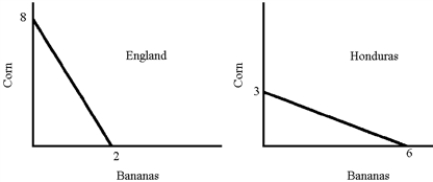
-From the graph in Figure 22-6, the opportunity cost of a unit of bananas is
A) 4 units of corn for England; 1/2 unit of corn for Honduras.
B) 1/4 unit of corn for England; 2 units of bananas in England.
C) 8 units of corn in England; 3 units of corn in Honduras.
D) 4 units of corn in England; 12 units of corn in Honduras.
Correct Answer:

Verified
Correct Answer:
Verified
Q74: The U.S.Constitution<br>A)prohibits tariffs on trade between Arkansas
Q76: A tariff affects imports<br>A)by limiting quantity and
Q93: Figure 22-5<br> <img src="https://d2lvgg3v3hfg70.cloudfront.net/TB2282/.jpg" alt="Figure 22-5
Q99: Quebec is capable of producing 10 pallets
Q106: Comparative advantage is illustrated by the slopes
Q134: A tariff on imports affects foreign suppliers
Q141: One of the main reasons that people
Q164: Discuss national defense, infant industry, and strategic
Q201: David Ricardo discovered that two countries can
Q209: Tariffs are different from quotas because they<br>A)increase