Multiple Choice
In the graph at right, X and Y represent 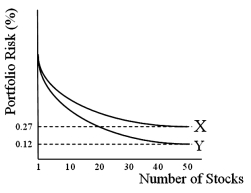
A) U.S. stocks and international stocks.
B) international stocks and U.S. stocks.
C) systematic risk and unsystematic risk.
D) none of the above
Correct Answer:

Verified
Correct Answer:
Verified
Q43: You will get more diversification<br>A)across industries than
Q44: Calculate the euro-based return an Italian investor
Q45: With regard to the past performance of
Q46: Calculate the euro-based return an Italian investor
Q49: Emerald Energy is an oil exploration and
Q50: Recent studies show that when investors control
Q51: The record of investing in U.S.-based MNCs<br>A)shows
Q52: With regard to the OIP,<br>A)the composition of
Q63: Calculate the euro-based return an Italian investor
Q75: American Depository Receipt (ADRs)represent foreign stocks<br>A)denominated in