Multiple Choice
Figure 4.5
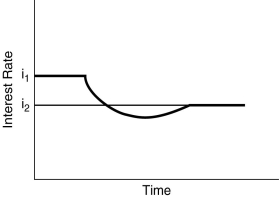
-Figure 4.5 illustrates the effect of an increased rate of money supply growth.From the figure,one can conclude that the liquidity effect is ________ than the expected inflation effect and interest rates adjust ________ to changes in expected inflation.
A) smaller; quickly
B) larger; quickly
C) larger; slowly
D) smaller; slowly
Correct Answer:

Verified
Correct Answer:
Verified
Q6: If the Fed wants to permanently lower
Q7: An increase in an asset's expected return
Q8: When the growth rate of the money
Q9: Investors make their choices of which assets
Q10: When the expected inflation rate increases,the demand
Q12: During an economic expansion,the supply of bonds
Q13: When the demand for bonds _ or
Q14: A rise in the price level causes
Q15: Figure 4.3<br> <img src="https://d2lvgg3v3hfg70.cloudfront.net/TB2777/.jpg" alt="Figure 4.3
Q16: Lower expected interest rates in the future