Multiple Choice
Figure 4.5
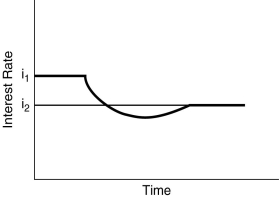
-Figure 4.5 illustrates the effect of an increased rate of money supply growth.From the figure,one can conclude that the
A) Fisher effect is dominated by the liquidity effect and interest rates adjust slowly to changes in expected inflation.
B) liquidity effect is dominated by the Fisher effect and interest rates adjust slowly to changes in expected inflation.
C) liquidity effect is dominated by the Fisher effect and interest rates adjust quickly to changes in expected inflation.
D) Fisher effect is smaller than the expected inflation effect and interest rates adjust quickly to changes in expected inflation.
Correct Answer:

Verified
Correct Answer:
Verified
Q100: What is the difference between systematic and
Q101: When bond prices become more volatile,the demand
Q102: When the expected inflation rate decreases,the demand
Q103: Figure 4.3<br> <img src="https://d2lvgg3v3hfg70.cloudfront.net/TB2777/.jpg" alt="Figure 4.3
Q104: When the interest rate on a bond
Q106: When the demand for bonds _ or
Q107: When the quantity of bonds demanded equals
Q108: Factors that cause the demand curve for
Q109: What is the expected return on a
Q110: Describe the factors that shift the demand