Essay
The following chart depicts 16 sample means that were taken at periodic intervals and plotted on a control chart. Does the output appear to be random? 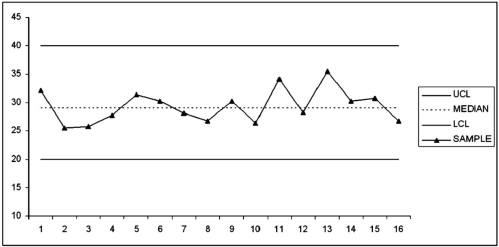
Correct Answer:

Verified
Since all points are within the control ...View Answer
Unlock this answer now
Get Access to more Verified Answers free of charge
Correct Answer:
Verified
Since all points are within the control ...
View Answer
Unlock this answer now
Get Access to more Verified Answers free of charge
Related Questions
Q7: A control chart used to monitor the
Q9: Control limits are based on multiples of
Q31: The amount of inspection needed is governed
Q32: The best way to assure quality is
Q42: Processes that are in control eliminate variations.
Q68: Given the following process control data
Q70: A design engineer wants to construct
Q74: The chair of the operations management
Q106: The number of defective parts in a
Q113: Low-cost, high-volume items often require more intensive