Multiple Choice
This graph shows the marginal costs and marginal benefits associated with roadside litter clean up.Assume that the marginal cost and marginal benefit curves slope in the usual directions. 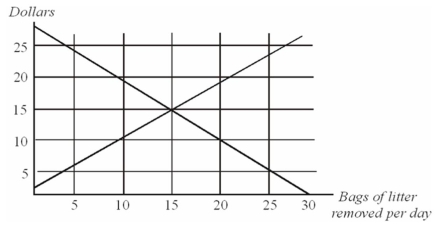
Refer to the information given above.The socially optimal number of bags of litter removed from the roadside is:
A) 10.
B) 15.
C) 20.
D) 30.
Correct Answer:

Verified
Correct Answer:
Verified
Q18: If the market equilibrium quantity is less
Q84: Shel and Fran are neighbors.They work at
Q85: Lunch in Jamie's dorm is an all-you-can-eat
Q86: Early settlers in the town of Dry
Q87: Suppose there are ten people playing cards
Q90: Lunch in Jamie's dorm is an all-you-can-eat
Q91: Generally,the Coase Theorem implies that the initial
Q92: A village has five residents,each of
Q93: The following data show the relationship
Q176: From the perspective of an externality, most