Multiple Choice
This graph shows the marginal costs and marginal benefits associated with roadside litter clean up.Assume that the marginal cost and marginal benefit curves slope in the usual directions. 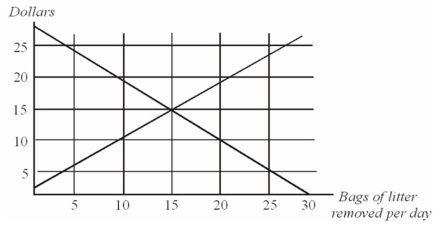
Refer to the information given above.From the graph,one can infer that:
A) the benefits of picking up the 10th bag of litter exceed the costs.
B) the costs of picking up the 10th bag exceed the benefits.
C) the benefits of picking up the 20th bag exceed the costs.
D) the total benefit of having 30 bags removed is less than the total benefit of having 25 bags removed.
Correct Answer:

Verified
Correct Answer:
Verified
Q55: The following payoff matrix shows the
Q56: Taylor lives in a residential neighborhood
Q57: The following payoff matrix shows the
Q58: Suppose that in most car collisions between
Q59: The following data show the relationship
Q61: Your economics professor has announced the following
Q62: From the individual's standpoint,participating in a positional
Q63: Suppose there are ten people playing cards
Q64: The inefficiency induced by all positional arms
Q65: The following data show the relationship