Multiple Choice
The following graphs depict a perfectly competitive firm and its market.
Assume that all firms in this industry have identical cost functions. 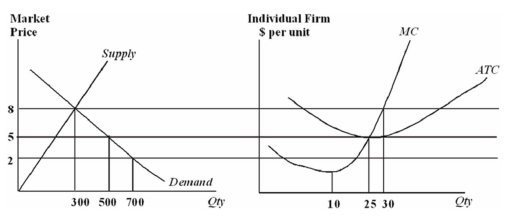
The long run equilibrium quantity in this industry is
A) 300.
B) 500.
C) 700.
D) more than 700.
Correct Answer:

Verified
Correct Answer:
Verified
Related Questions
Q67: Which ordering best describes how a perfectly
Q68: Pat used to work as an aerobics
Q69: Consumer surplus is the value of:<br>A)consumer spending
Q71: E-commerce and an internet presence are important
Q73: Ingrid has been waiting for the show
Q74: If a firm is earning zero economic
Q75: Suppose a market is in equilibrium.The area
Q76: Which of the following describes a surplus-enhancing
Q77: Factors of production most likely to earn
Q102: Some people have argued that the government